All states ranked by ultrasound tech salary
The table ranks all 50 states and the District of Columbia by the annual median wage of diagnostic medical sonographers, with the hourly median, the gap to the U.S. median, payroll employment and the 10th and 90th percentiles.[1][3] 24 states pay more than the national median of $96,590 and 27 pay less. Every state value was checked against the BLS Public Data API series for May 2025 on Nov 20, 2026.[2] BLS published a median, a 10th and a 90th percentile for every state in this release, so no row is suppressed; a value BLS withholds in a later release will show as "Suppressed".
| Rank and state | Annual median | Hourly median | vs U.S. median | Employment | 10th percentile | 90th percentile |
|---|---|---|---|---|---|---|
| United States | $96,590 | $46.44 | — | 90,160 | $67,820 | $129,370 |
| 1. California | $128,530 | $61.79 | +33% | 10,110 | $62,890 | $177,780 |
| 2. Hawaii | $124,430 | $59.82 | +29% | 210 | $83,900 | $135,660 |
| 3. Washington | $121,340 | $58.34 | +26% | 2,190 | $61,840 | $156,860 |
| 4. Oregon | $120,220 | $57.80 | +24% | 1,210 | $91,960 | $135,150 |
| 5. District of Columbia | $112,020 | $53.86 | +16% | 160 | $93,590 | $135,280 |
| 6. Colorado | $108,410 | $52.12 | +12% | 1,430 | $85,500 | $130,720 |
| 7. Massachusetts | $107,480 | $51.67 | +11% | 2,190 | $89,190 | $133,480 |
| 8. Alaska | $105,670 | $50.80 | +9% | 140 | $78,170 | $126,540 |
| 9. Vermont | $104,100 | $50.05 | +8% | 140 | $80,190 | $134,080 |
| 10. New York | $103,920 | $49.96 | +8% | 6,880 | $79,630 | $127,120 |
| 11. New Hampshire | $103,760 | $49.88 | +7% | 400 | $82,110 | $134,220 |
| 12. Connecticut | $103,230 | $49.63 | +7% | 990 | $77,790 | $129,480 |
| 13. New Jersey | $103,150 | $49.59 | +7% | 3,370 | $80,090 | $134,550 |
| 14. Minnesota | $102,850 | $49.45 | +6% | 1,710 | $84,020 | $120,220 |
| 15. Wisconsin | $102,090 | $49.08 | +6% | 1,530 | $82,430 | $124,450 |
| 16. Montana | $101,000 | $48.56 | +5% | 230 | $80,750 | $121,260 |
| 17. Illinois | $100,660 | $48.39 | +4% | 3,270 | $78,350 | $122,680 |
| 18. Wyoming | $100,650 | $48.39 | +4% | 90 | $80,390 | $136,830 |
| 19. Missouri | $100,130 | $48.14 | +4% | 1,930 | $76,820 | $106,090 |
| 20. Utah | $100,100 | $48.13 | +4% | 740 | $70,030 | $124,760 |
| 21. Arizona | $100,040 | $48.10 | +4% | 2,070 | $74,010 | $127,510 |
| 22. Idaho | $99,920 | $48.04 | +3% | 510 | $79,290 | $117,100 |
| 23. Maryland | $99,210 | $47.70 | +3% | 1,760 | $80,940 | $118,520 |
| 24. Delaware | $98,530 | $47.37 | +2% | 220 | $83,240 | $115,800 |
| 25. Kansas | $96,310 | $46.30 | 0% | 670 | $72,420 | $112,520 |
| 26. Nevada | $95,980 | $46.14 | −1% | 640 | $74,960 | $133,250 |
| 27. Virginia | $95,660 | $45.99 | −1% | 2,160 | $77,540 | $122,930 |
| 28. Maine | $95,230 | $45.78 | −1% | 380 | $78,330 | $125,130 |
| 29. Rhode Island | $92,820 | $44.63 | −4% | 380 | $83,690 | $129,690 |
| 30. Texas | $92,580 | $44.51 | −4% | 6,960 | $64,360 | $106,090 |
| 31. Kentucky | $91,230 | $43.86 | −6% | 940 | $62,440 | $115,390 |
| 32. New Mexico | $87,210 | $41.93 | −10% | 410 | $65,250 | $108,030 |
| 33. Iowa | $86,480 | $41.58 | −10% | 740 | $72,480 | $101,970 |
| 34. North Carolina | $86,010 | $41.35 | −11% | 2,970 | $67,070 | $105,530 |
| 35. Indiana | $85,040 | $40.88 | −12% | 1,380 | $62,850 | $103,320 |
| 36. North Dakota | $84,340 | $40.55 | −13% | 240 | $66,890 | $102,570 |
| 37. Oklahoma | $83,670 | $40.23 | −13% | 1,060 | $64,610 | $102,570 |
| 38. South Carolina | $83,290 | $40.04 | −14% | 1,340 | $69,530 | $102,540 |
| 39. Georgia | $83,250 | $40.02 | −14% | 2,700 | $62,120 | $104,930 |
| 40. Florida | $82,940 | $39.88 | −14% | 6,670 | $66,230 | $103,570 |
| 41. Ohio | $82,870 | $39.84 | −14% | 3,160 | $65,480 | $101,190 |
| 42. Pennsylvania | $82,710 | $39.76 | −14% | 2,980 | $68,370 | $103,570 |
| 43. Nebraska | $82,670 | $39.75 | −14% | 780 | $64,590 | $105,320 |
| 44. Michigan | $82,490 | $39.66 | −15% | 3,100 | $66,960 | $96,360 |
| 45. Arkansas | $81,500 | $39.18 | −16% | 640 | $64,280 | $102,190 |
| 46. South Dakota | $80,820 | $38.86 | −16% | 370 | $51,100 | $98,090 |
| 47. Louisiana | $80,710 | $38.80 | −16% | 1,150 | $62,900 | $98,500 |
| 48. Tennessee | $80,640 | $38.77 | −17% | 1,880 | $62,220 | $101,830 |
| 49. West Virginia | $76,820 | $36.93 | −20% | 780 | $64,750 | $99,060 |
| 50. Mississippi | $76,520 | $36.79 | −21% | 700 | $59,660 | $92,340 |
| 51. Alabama | $68,180 | $32.78 | −29% | 1,510 | $51,700 | $83,220 |
Hourly median = annual median ÷ 2,080 hours, the BLS convention. Employment: OEWS wage-and-salary jobs, rounded by BLS. "Suppressed" = not published by BLS for that state. States with their own metro-by-metro page are linked.
Download this table as CSV (52 rows, the same figures, unpublished values marked "suppressed").
Highest-paying states for ultrasound techs
California pays ultrasound techs the most, a $128,530 median ($61.79 an hour), followed by Hawaii at $124,430 and Washington at $121,340.[1] 21 states have a median of $100,000 or more: California, Hawaii, Washington, Oregon, District of Columbia, Colorado, Massachusetts, Alaska, Vermont, New York, New Hampshire, Connecticut, New Jersey, Minnesota, Wisconsin, Montana, Illinois, Wyoming, Missouri, Utah, Arizona. The top of the ranking is the West Coast and the Northeast, where hospital wages and living costs are both high; the leader's median is +33% against the U.S. figure.
Lowest-paying states
The bottom of the ranking is West Virginia ($76,820), Mississippi ($76,520), Alabama ($68,180).[1] The gap between first and last place is $60,350 a year, or $29.01 an hour. A lower state median does not mean the same job pays less in every city: metro areas inside one state can differ by more than the gap between neighboring states, which is why the state pages on this site list every metro BLS publishes.
Pay spread inside each state
The distance between the 10th and the 90th percentile shows how far pay ranges for the same occupation inside one state. It is widest in California ($62,890 to $177,780), Washington ($61,840 to $156,860), Nevada ($74,960 to $133,250) and narrowest in Missouri ($76,820 to $106,090), Michigan ($66,960 to $96,360), Iowa ($72,480 to $101,970).[1] In a wide-spread state, the employer, the metro area and experience matter more than the state median; in a narrow one, most offers sit close to it. The 10th percentile is the nearest public figure to a starting wage, but BLS does not publish pay by years of experience.[4]
Where the jobs are vs where the pay is
The five states with the most ultrasound tech jobs are California (10,110 jobs, #1 on pay), Texas (6,960 jobs, #30 on pay), New York (6,880 jobs, #10 on pay), Florida (6,670 jobs, #40 on pay), New Jersey (3,370 jobs, #13 on pay).[1] Together they employ 38% of the 90,160 sonographers on U.S. payrolls. A large job market gives more openings and more employers to compare, while a high median alone can come from a small number of jobs.
Ultrasound tech salary adjusted for cost of living
Adjusted for the state price level, Oregon pays ultrasound techs the most: its $120,220 median is worth $116,311 at U.S. average prices, just ahead of California ($116,086), which ranks first before the adjustment.[1][5] We divided each state's May 2025 median by its Regional Price Parity, the Bureau of Economic Analysis measure of how much more or less the same goods, services and rent cost there than the U.S. average (U.S. = 100; latest year 2024).[5]
Key findings
- Oregon has the highest cost-of-living adjusted ultrasound tech salary, $116,311, and Alabama the lowest, $76,759 (BLS OEWS May 2025 medians, BEA Regional Price Parities 2024).
- Kansas gains the most from the adjustment, moving from 25th to 8th place, while New Jersey loses the most, falling from 13th to 31st.
- 25 of the 50 states and DC pay ultrasound techs more than the $96,590 national median once prices are taken into account; California's $128,530 median shrinks to $116,086 because prices there are 10.7% above the U.S. average.
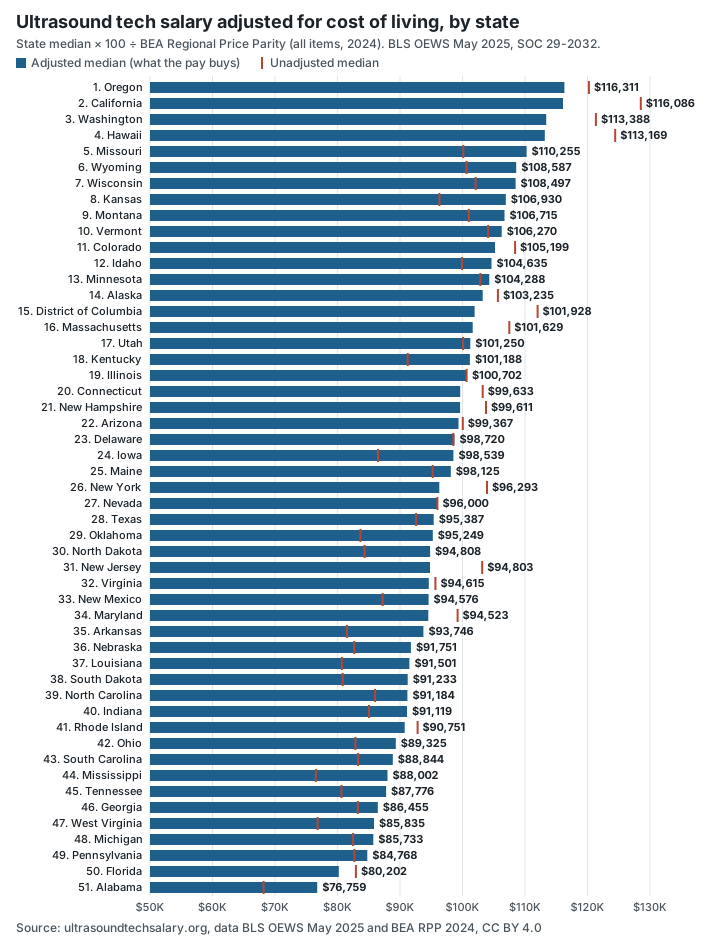
| Adjusted rank and state | Price level (U.S. = 100) | Ultrasound tech median | Ultrasound tech adjusted | Rank change | Radiology tech adjusted | MRI tech adjusted |
|---|---|---|---|---|---|---|
| 1. Oregon | 103.4 | $120,220 | $116,311 | up 3 | $98,964 | $117,956 |
| 2. California | 110.7 | $128,530 | $116,086 | down 1 | $109,520 | $111,994 |
| 3. Washington | 107.0 | $121,340 | $113,388 | no change | $95,400 | $114,706 |
| 4. Hawaii | 110.0 | $124,430 | $113,169 | down 2 | $92,496 | $108,567 |
| 5. Missouri | 90.8 | $100,130 | $110,255 | up 14 | $80,470 | $91,514 |
| 6. Wyoming | 92.7 | $100,650 | $108,587 | up 12 | $84,000 | $99,265 |
| 7. Wisconsin | 94.1 | $102,090 | $108,497 | up 8 | $84,106 | $100,664 |
| 8. Kansas | 90.1 | $96,310 | $106,930 | up 17 | $84,458 | $91,786 |
| 9. Montana | 94.6 | $101,000 | $106,715 | up 7 | $81,431 | $91,870 |
| 10. Vermont | 98.0 | $104,100 | $106,270 | down 1 | $96,511 | $105,219 |
| 11. Colorado | 103.1 | $108,410 | $105,199 | down 5 | $85,161 | $102,259 |
| 12. Idaho | 95.5 | $99,920 | $104,635 | up 10 | $83,859 | $106,478 |
| 13. Minnesota | 98.6 | $102,850 | $104,288 | up 1 | $84,566 | $102,311 |
| 14. Alaska | 102.4 | $105,670 | $103,235 | down 6 | $96,640 | $117,830 |
| 15. District of Columbia | 109.9 | $112,020 | $101,928 | down 10 | $93,511 | $117,114 |
| 16. Massachusetts | 105.8 | $107,480 | $101,629 | down 9 | $97,979 | $104,579 |
| 17. Utah | 98.9 | $100,100 | $101,250 | up 3 | $81,931 | $92,197 |
| 18. Kentucky | 90.2 | $91,230 | $101,188 | up 13 | $77,275 | $91,172 |
| 19. Illinois | 100.0 | $100,660 | $100,702 | down 2 | $79,964 | $95,420 |
| 20. Connecticut | 103.6 | $103,230 | $99,633 | down 8 | $88,766 | $102,625 |
| 21. New Hampshire | 104.2 | $103,760 | $99,611 | down 10 | $81,515 | $101,205 |
| 22. Arizona | 100.7 | $100,040 | $99,367 | down 1 | $88,600 | $99,924 |
| 23. Delaware | 99.8 | $98,530 | $98,720 | up 1 | $84,372 | $103,709 |
| 24. Iowa | 87.8 | $86,480 | $98,539 | up 9 | $75,124 | $92,774 |
| 25. Maine | 97.0 | $95,230 | $98,125 | up 3 | $82,514 | $97,002 |
| 26. New York | 107.9 | $103,920 | $96,293 | down 16 | $91,243 | $104,956 |
| 27. Nevada | 100.0 | $95,980 | $96,000 | down 1 | $82,927 | $98,281 |
| 28. Texas | 97.1 | $92,580 | $95,387 | up 2 | $81,014 | $99,715 |
| 29. Oklahoma | 87.8 | $83,670 | $95,249 | up 8 | $84,423 | $99,587 |
| 30. North Dakota | 89.0 | $84,340 | $94,808 | up 6 | $76,204 | $90,615 |
| 31. New Jersey | 108.8 | $103,150 | $94,803 | down 18 | $87,312 | $95,520 |
| 32. Virginia | 101.1 | $95,660 | $94,615 | down 5 | $79,789 | $97,563 |
| 33. New Mexico | 92.2 | $87,210 | $94,576 | down 1 | $86,692 | $95,270 |
| 34. Maryland | 105.0 | $99,210 | $94,523 | down 11 | $81,832 | $100,258 |
| 35. Arkansas | 86.9 | $81,500 | $93,746 | up 10 | $73,202 | $90,617 |
| 36. Nebraska | 90.1 | $82,670 | $91,751 | up 7 | $80,863 | $91,795 |
| 37. Louisiana | 88.2 | $80,710 | $91,501 | up 10 | $72,194 | $87,873 |
| 38. South Dakota | 88.6 | $80,820 | $91,233 | up 8 | $73,646 | $86,932 |
| 39. North Carolina | 94.3 | $86,010 | $91,184 | down 5 | $78,928 | $90,240 |
| 40. Indiana | 93.3 | $85,040 | $91,119 | down 5 | $83,190 | $93,090 |
| 41. Rhode Island | 102.3 | $92,820 | $90,751 | down 12 | $83,428 | $102,718 |
| 42. Ohio | 92.8 | $82,870 | $89,325 | down 1 | $84,420 | $94,498 |
| 43. South Carolina | 93.7 | $83,290 | $88,844 | down 5 | $74,241 | $89,121 |
| 44. Mississippi | 87.0 | $76,520 | $88,002 | up 6 | $68,198 | $82,470 |
| 45. Tennessee | 91.9 | $80,640 | $87,776 | up 3 | $70,349 | $85,567 |
| 46. Georgia | 96.3 | $83,250 | $86,455 | down 7 | $77,420 | $95,604 |
| 47. West Virginia | 89.5 | $76,820 | $85,835 | up 2 | $82,852 | $89,936 |
| 48. Michigan | 96.2 | $82,490 | $85,733 | down 4 | $79,425 | $87,947 |
| 49. Pennsylvania | 97.6 | $82,710 | $84,768 | down 7 | $77,942 | $93,387 |
| 50. Florida | 103.4 | $82,940 | $80,202 | down 10 | $74,216 | $81,546 |
| 51. Alabama | 88.8 | $68,180 | $76,759 | no change | $68,338 | $88,817 |
Adjusted = state annual median × 100 ÷ state Regional Price Parity (all items, 2024). Rank change compares the adjusted rank with the unadjusted ultrasound tech rank in the first table. The price level covers goods, services and housing rents for the whole state; city prices can differ. Radiology tech is SOC 29-2034 and MRI tech SOC 29-2035, same release.[5][2] "Suppressed" = no published BLS median.
State pages with metro-area detail
- Ultrasound tech salary in California: every California metro and nonmetro area, and West Coast neighbors.
- Ultrasound tech salary in Texas: Dallas, Houston, Austin, San Antonio and the rest of the state, with no state income tax.
- Ultrasound tech salary in Florida: Florida metro areas and Florida vs the U.S.
- Radiology techs: California, Texas and Florida. MRI techs: California and Texas.
- The national view, with a take-home pay calculator by state and metro: ultrasound tech salary.
How to read these figures
OEWS is a survey of employers. The figures are wages paid to wage-and-salary workers in May 2025; they leave out the self-employed, overtime pay, shift differentials, on-call pay, bonuses and benefits.[4] The median is the wage that half of workers in a state earn more than, which is why it is used for the ranking instead of the mean. Two states a few hundred dollars apart are effectively tied, because each state estimate carries sampling error. BLS withholds a value when too few employers responded or when publishing it would identify an employer; this page shows any such cell as "Suppressed" instead of filling it in.[1]
Frequently asked questions
Which state pays ultrasound techs the most?
California, with a median of $128,530 a year in BLS May 2025 data, followed by Hawaii ($124,430) and Washington ($121,340).
Which state pays ultrasound techs the least?
Alabama, at a $68,180 median, $28,410 below the U.S. median of $96,590.
How many states pay ultrasound techs over $100,000?
21 states have a median of $100,000 or more in May 2025: California, Hawaii, Washington, Oregon, District of Columbia, Colorado, Massachusetts, Alaska, Vermont, New York, New Hampshire, Connecticut, New Jersey, Minnesota, Wisconsin, Montana, Illinois, Wyoming, Missouri, Utah, Arizona.
What is the hourly pay for ultrasound techs by state?
The hourly median ranges from $32.78 in Alabama to $61.79 in California; the U.S. hourly median is $46.44. The table lists every state.
Which state pays ultrasound techs the most after cost of living?
Oregon: its $120,220 median equals $116,311 at U.S. average prices (BEA Regional Price Parities 2024). The full adjusted ranking, with radiology and MRI techs, is in the cost-of-living section above.
Where does this data come from?
The U.S. Bureau of Labor Statistics Occupational Employment and Wage Statistics survey, May 2025 estimates released May 15, 2026, for diagnostic medical sonographers (SOC 29-2032). It is the latest release as of Nov 20, 2026.
Sources
- OEWS May 2025 estimates (released May 15, 2026): national and state wages and employment for 29-2032 Diagnostic Medical Sonographers
- OEWS May 2025 state series for 29-2032 via the BLS Public Data API (10th, 25th, 50th, 75th and 90th percentile annual wage, hourly median; every state checked against the table on this site)
- Local Wages: 29-2032.00 Diagnostic Medical Sonographers (state and metro percentiles)
- OEWS Frequently Asked Questions (wage definition; 2,080-hour year)
- Regional Price Parities by State (SARPP), all items, 2024 (U.S. = 100); new statistics for 2024 released Feb 19, 2026